Summary
This is an exercise dedicated to practicing Web Scraping which has become an increasingly difficult task in this day-and-age of AI. Most websites do not allow for webscraping as they might unknowingly have four years ago.
I originally conducted this same project in university on LinkedIn to collect job postings for “Data Analyst” related roles. Unfortunately, most sites have changed their request privileges for visitors and now provide a bot.txt files to inform the visitor what are their limitations. Of course, this is in response to the wide spread of web crawler bots that will scan sites and extra any data they can.
So many websites with active feeds put a cap in order to:
Not overload the servers with 1000s of requests on top of their normal visitors.
Prevent bots from taking data and risking exploitation of vulnerabilities.
Of course, there are plenty of other reasons involved, but it has nonetheless become increasingly harder to perform this exercise.
However, for this case, I a have performed a simple web scraping task on this wikipedia page: https://en.wikipedia.org/wiki/List_of_largest_companies_in_the_United_States_by_revenue
Showing information about the largest companies in the United States by Revenue as of 2025.
To do this project, I first created a Jupyter Notebook file where we will run everything using Python and BeautifulSoup, requests, and pandas libraries.
Step 1:
import the libraries we will need to use for this project:
BeautifulSoup
requests
Pandas
Step 2:
Define the url, which we will call to request the html from its page. Additionally, we will need to request permission to by stating who we are and what are intention is for requesting data using our script.
url = '<https://en.wikipedia.org/wiki/List_of_largest_companies_in_the_United_States_by_revenue>
url = '<https://en.wikipedia.org/wiki/List_of_largest_companies_in_the_United_States_by_revenue>
url = '<https://en.wikipedia.org/wiki/List_of_largest_companies_in_the_United_States_by_revenue>
If you test the new “soup”, you might see something like:
<!DOCTYPE html>
<html class="client-nojs vector-feature-language-in-header-enabled vector-feature-language-in-main-menu-disabled vector-feature-language-in-main-page-header-disabled vector-feature-page-tools-pinned-disabled
vector-feature-toc-pinned-clientpref-1 vector-feature-main-menu-pinned-disabled vector-feature-limited-width-clientpref-1 vector-feature-limited-width-content-enabled vector-feature-custom-font-size-clientpref-1
vector-feature-appearance-pinned-clientpref-1 skin-theme-clientpref-day vector-feature-navigation-update-disabled vector-sticky-header-enabled vector-toc-available skin-thumbsize-clientpref-standard" dir="ltr" lang="en">
 <head>
  <meta charset="utf-8"/>
  <title>
   List of largest companies in the United States by revenue - Wikipedia
  </title>
  <script>
   (function(){var className="client-js vector-feature-language-in-header-enabled vector-feature-language-in-main-menu-disabled vector-feature-language-in-main-page-header-disabled vector-featur
<!DOCTYPE html>
<html class="client-nojs vector-feature-language-in-header-enabled vector-feature-language-in-main-menu-disabled vector-feature-language-in-main-page-header-disabled vector-feature-page-tools-pinned-disabled
vector-feature-toc-pinned-clientpref-1 vector-feature-main-menu-pinned-disabled vector-feature-limited-width-clientpref-1 vector-feature-limited-width-content-enabled vector-feature-custom-font-size-clientpref-1
vector-feature-appearance-pinned-clientpref-1 skin-theme-clientpref-day vector-feature-navigation-update-disabled vector-sticky-header-enabled vector-toc-available skin-thumbsize-clientpref-standard" dir="ltr" lang="en">
 <head>
  <meta charset="utf-8"/>
  <title>
   List of largest companies in the United States by revenue - Wikipedia
  </title>
  <script>
   (function(){var className="client-js vector-feature-language-in-header-enabled vector-feature-language-in-main-menu-disabled vector-feature-language-in-main-page-header-disabled vector-featur
<!DOCTYPE html>
<html class="client-nojs vector-feature-language-in-header-enabled vector-feature-language-in-main-menu-disabled vector-feature-language-in-main-page-header-disabled vector-feature-page-tools-pinned-disabled
vector-feature-toc-pinned-clientpref-1 vector-feature-main-menu-pinned-disabled vector-feature-limited-width-clientpref-1 vector-feature-limited-width-content-enabled vector-feature-custom-font-size-clientpref-1
vector-feature-appearance-pinned-clientpref-1 skin-theme-clientpref-day vector-feature-navigation-update-disabled vector-sticky-header-enabled vector-toc-available skin-thumbsize-clientpref-standard" dir="ltr" lang="en">
 <head>
  <meta charset="utf-8"/>
  <title>
   List of largest companies in the United States by revenue - Wikipedia
  </title>
  <script>
   (function(){var className="client-js vector-feature-language-in-header-enabled vector-feature-language-in-main-menu-disabled vector-feature-language-in-main-page-header-disabled vector-featur
Of course, it will go on for miles because it is returning the entire html file for you.
Step 3:
On this page, you will find the main table that we are looking for containing all the data we need. We will need to identify which table it is labeled within the html in our “soup”. To do this, write:
You should then see something like the following:
[<table class="wikitable sortable" id="mwOw">
 <caption id="mwPA"></caption>
 <tbody id="mwPQ"><tr id="mwPg"><th id="mwPw">Rank</th>
 <th id="mwQA">Name</th>
 <th id="mwQQ">Industry</th>
 <th id="mwQg">Revenue <br id="mwQw"/>(USD millions)</th>
 <th id="mwRA">Revenue growth</th>
 <th id="mwRQ">Employees</th>
 <th id="mwRg">Headquarters</th></tr>
 <tr id="mwRw">
 <td id="mwSA">1</td>
 <td id="mwSQ"><a href="<https://en.wikipedia.org/wiki/Walmart>" id="mwSg" rel="mw:WikiLink" title="Walmart">Walmart</a></td>
 <td id="mwSw">Retail</td>
 <td id="mwTA" style="text-align:center;">680,985</td>
<td id="mwTQ" style="text-align:center;"><span about="#mwt7" data-mw='{"caption":"Increase","parts":[{"template":{"target":{"wt":"profit","href":"./Template:Profit"},"params":{},"i":0}}]}'[<table class="wikitable sortable" id="mwOw">
<caption id="mwPA"></caption>
<tbody id="mwPQ"><tr id="mwPg"><th id="mwPw">Rank</th>
<th id="mwQA">Name</th>
<th id="mwQQ">Industry</th>
<th id="mwQg">Revenue <br id="mwQw"/>(USD millions)</th>
<th id="mwRA">Revenue growth</th>
<th id="mwRQ">Employees</th>
<th id="mwRg">Headquarters</th></tr>
<tr id="mwRw">
<td id="mwSA">1</td>
<td id="mwSQ"><a href="<https://en.wikipedia.org/wiki/Walmart>" id="mwSg" rel="mw:WikiLink" title="Walmart">Walmart</a></td>
<td id="mwSw">Retail</td>
<td id="mwTA" style="text-align:center;">680,985</td>
<td id="mwTQ" style="text-align:center;"><span about="#mwt7" data-mw='{"caption":"Increase","parts":[{"template":{"target":{"wt":"profit","href":"./Template:Profit"},"params":{},"i":0}}]}'[<table class="wikitable sortable" id="mwOw">
<caption id="mwPA"></caption>
<tbody id="mwPQ"><tr id="mwPg"><th id="mwPw">Rank</th>
<th id="mwQA">Name</th>
<th id="mwQQ">Industry</th>
<th id="mwQg">Revenue <br id="mwQw"/>(USD millions)</th>
<th id="mwRA">Revenue growth</th>
<th id="mwRQ">Employees</th>
<th id="mwRg">Headquarters</th></tr>
<tr id="mwRw">
<td id="mwSA">1</td>
<td id="mwSQ"><a href="<https://en.wikipedia.org/wiki/Walmart>" id="mwSg" rel="mw:WikiLink" title="Walmart">Walmart</a></td>
<td id="mwSw">Retail</td>
<td id="mwTA" style="text-align:center;">680,985</td>
<td id="mwTQ" style="text-align:center;"><span about="#mwt7" data-mw='{"caption":"Increase","parts":[{"template":{"target":{"wt":"profit","href":"./Template:Profit"},"params":{},"i":0}}]}'This would also go on for miles, but you should see the id at the very top next to the table class “wikitable sortable”. By inspecting the web page in the browser, we can confirm that this is the table we want. So we will proceed to identify the table and place it in its own new variable:
Step 4:
Next, we will want to get the headers of the table, so that we can then place them in a list, in which we can later turn into the headers of our own readable table.
printing this should result in:
[<th id="mwPw">Rank</th>,
 <th id="mwQA">Name</th>,
 <th id="mwQQ">Industry</th>,
 <th id="mwQg">Revenue <br id="mwQw"/>(USD millions)</th>,
 <th id="mwRA">Revenue growth</th>,
 <th id="mwRQ">Employees</th>,
 <th id="mwRg">Headquarters</th>
[<th id="mwPw">Rank</th>,
 <th id="mwQA">Name</th>,
 <th id="mwQQ">Industry</th>,
 <th id="mwQg">Revenue <br id="mwQw"/>(USD millions)</th>,
 <th id="mwRA">Revenue growth</th>,
 <th id="mwRQ">Employees</th>,
 <th id="mwRg">Headquarters</th>
[<th id="mwPw">Rank</th>,
 <th id="mwQA">Name</th>,
 <th id="mwQQ">Industry</th>,
 <th id="mwQg">Revenue <br id="mwQw"/>(USD millions)</th>,
 <th id="mwRA">Revenue growth</th>,
 <th id="mwRQ">Employees</th>,
 <th id="mwRg">Headquarters</th>
Now, let’s simplify this so it’s only the titles and not the html elements.
world_table_titles = [title.text.strip() for title in world_titles]
world_table_titles = [title.text.strip() for title in world_titles]
world_table_titles = [title.text.strip() for title in world_titles]
What this is essentially doing is:
Taking world_titles, and looking at each listed item, which we have given the placeholder of “title”.
We then take each title and strip it down to just the minimal text.
Putting everything together, we are performing a shorthand within an empty list by placing it all in the square brackets.
[title.text.strip() for title in world_titles]
[title.text.strip() for title in world_titles]
[title.text.strip() for title in world_titles]
defining this as world_table_titles, and printing this, we should get:
['Rank',
 'Name',
 'Industry',
 'Revenue (USD millions)',
 'Revenue growth',
 'Employees',
 'Headquarters']
['Rank',
 'Name',
 'Industry',
 'Revenue (USD millions)',
 'Revenue growth',
 'Employees',
 'Headquarters']
['Rank',
 'Name',
 'Industry',
 'Revenue (USD millions)',
 'Revenue growth',
 'Employees',
 'Headquarters']
Pandas
Now that we have officially defined our headers, we can then create our table, and prepare to collect the data from this wikipedia page:
Step 5:
Remember to import all the essential libraries as noted in the beginning. You will need to make sure to have imported pandas and label it as “pd” for shorthand and consistency through out the last steps.
First, we will create a table by defining a DataFrame “df”.
Calling “df” should give you:
Step 6:
Next, we will need to find all the table row elements in the wiki table.
With this, we will perform a “for loop”, starting on the next index after the header, so that we don’t mix the headers in with all the data. We will need to find all the ‘td’ elements within each row, and then place them each in our new dataframe table.
We can do this with the following:
# column_data[1:] takes takes the next row passed the header
for row in column_data[1:] :
	row_data = row.find_all('td')
	individual_row_data = [data.text for data in row_data]
# column_data[1:] takes takes the next row passed the header
for row in column_data[1:] :
row_data = row.find_all('td')
individual_row_data = [data.text for data in row_data]# column_data[1:] takes takes the next row passed the header
for row in column_data[1:] :
row_data = row.find_all('td')
individual_row_data = [data.text for data in row_data]Inside of individual_row_data, we are performing another shorthand “for loop” where we are taking the text in the ‘td’ elements.
We will then place the data found in “individual_row_data” and place them in “df”. Make sure to keep it tabbed within the original “for loop” so it cycles through and places everything in the new dataframe.
# for row in column_data[1:]
# for row in column_data[1:]
# for row in column_data[1:]
So the full “for loop” should look like:
for row in column_data[1:]:
    row_data = row.find_all('td')
    individual_row_data = [data.text for data in row_data]
for row in column_data[1:]:
    row_data = row.find_all('td')
    individual_row_data = [data.text for data in row_data]
for row in column_data[1:]:
    row_data = row.find_all('td')
    individual_row_data = [data.text for data in row_data]
Let’s break this down so we understand what’s happening.
column_data = table.find_all(’tr’)
We are finding all the rows within the table and defining them as column_data.
row_data = row.find_all(’td’)
We are looping through each row and finding each cell of data.
individual_row_data
We are then extracting the text from each html element within each cell.
length
Then, we look at the current length of the dataframe.
df.loc[length]
And place the current row of data at that length location.
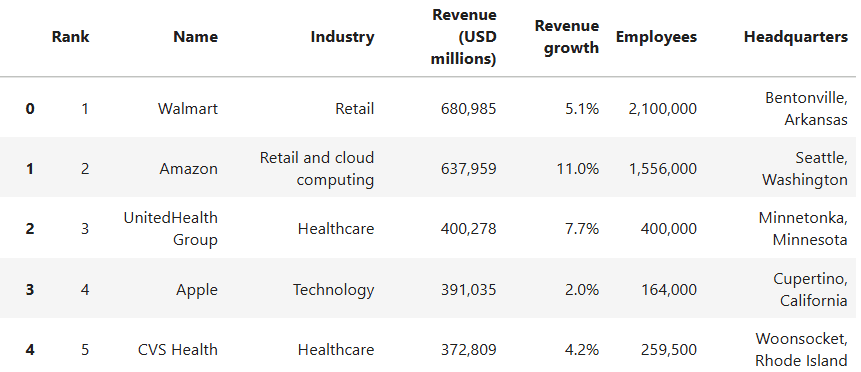
If you then print “df”, you should see something similar to:
Step 7:
Lastly, we want to be able to take this data and be able to work with it in Excel, or be able to share it with others. We will need to format this as a CSV file, and save it within a certain place. You can choose anywhere on your computer, as long as you copy the address within file explorer.
Your address might look something like:
Remember to include the ‘r’ at the beginning of the address, just outside of the quotations, as it will tell the code to read the entire string address, instead of seeing certain characters as stops or code.
Final Statements
The project is fairly straight forward and can become very useful when permission is provided on larger websites.
I originally began this project, hoping to attempt web scraping with Amazon. That is when I had realized the difficulties with web scraping nowadays. I had received the bot.txt file when running my script with no ways to getting around the permissions to resume my exercise.
Even when running this project to receive the data from Wikipedia, I had to learn how to work through Wikipedia’s requirements to perform requests. That is how I had come to learn the need for a “header”, which provided my email in case there was any violations on my end as a “User-Agent”.
My hope is to be able to work with a larger dataset that would challenge me to utilize Pandas in a more comprehensive way for data visualization and analysis. Yet, for the time being, I now can extract data using Python off the web.
For the most part, APIs are some of the most reliable sources to requesting data. Many of them would require payments, but there are free ones out there in case you want to practice with larger datasets from officials sources.
Thank you for reading my findings, I would be happy to share any deeper technical insights or answer any questions you may have.
Please feel free to reach out to me either on LinkedIn or by submitting a contact form here.
